
Published by: Zaya
Published date: 25 Jun 2021

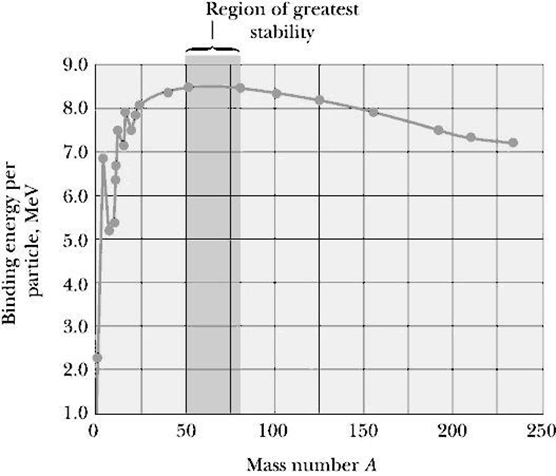
Analysis of binding energy curve gives the detail information of various elements corresponding to their energy which binds the nucleus. The nature of the binding energy curve is shown in the figure. It shows that binding energy per nucleon increases up to the element Fe whose atm. no. is 26 and the mass number is 57? For Fe, the binding energy per nucleon becomes highest which is 8.7 meV the elements whose atm. no . is greater than iron or mass no. greater than 57, binding energy slowly decreases. The elements whose atomic mass no. is around 200, binding energy becomes around 7meV. The element whose mass number is above 200 shows radioactive behaviour. IT is so because these elements disintegrate spontaneously without any external agents. The element whose atm. mass no. is up to 57 cannot disintegrate but these elements undergo fusion process. The elements whose mass no. is around 57 to around 200 cannot undergo fusion process but they undergo fission process. That information indicates that Fe and its nearby elements are most stable i.e. neither they go fission on nor they go fusion Significance of Binding energy curve: Binding energy curve is an indicator ID reflects nuclear stability. It also helps to classify the element which undergoes fission, fusion and radioactivity disintegration.