
Published by: sadikshya
Published date: 02 Jul 2021
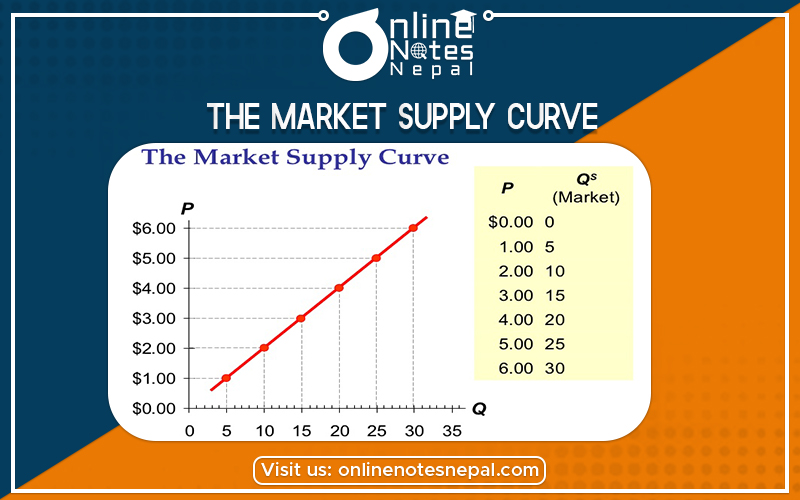
The market supply curve shows the supply of a commodity at different price levels. It is the sum of all individual supply schedule in the market producing the commodity. The aggregate of individual firms is known as an industry in the market. The market supply schedule shows the response of market supply towards price changes. It can be explained in the following table.
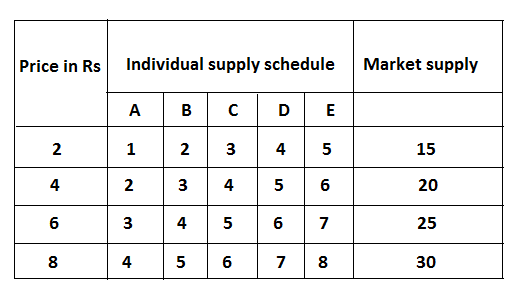
The above table shows the aggregate supply of the market comparing five firms. The rising of price quantity supply of the market, it also raises the derivation of market supply, it can be explained by the following figure.
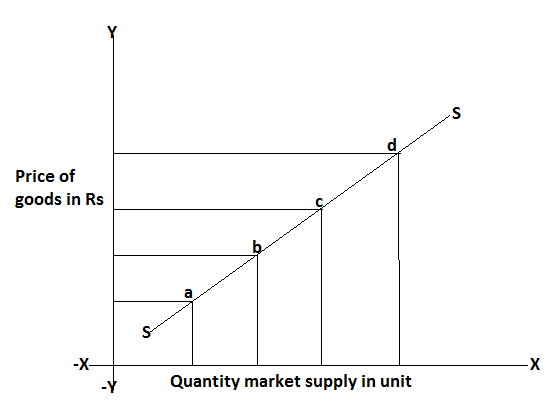
In this figure price and quantity, supply is measure along the OY axis and OX axis respectively. The market supply curve represented by SS which is derived by joining the point a, b, c, and d various prices and respective quantity supply, thus the market supply curve also shows the direct and positive relationship between price and quantity supply.
Movement along with the supply
If the quantity supplies increases or decreases in response to rising or fall in the price of the commodity assume in other determinants as constant, it is known as movement along the supply curve. Movement along the supply curve is two types.
When the quantity supply increases with the rise in price, it is called the expansion of supply. In this case, we move the equilibrium point upward and the same supply curve.
When the quantity supply decreases with the fall in price, it is called contraction of supply. In this case, the equilibrium points downward as the sum same supply curve.
Movement along the supply curve is further explaining with the help of the following figure.
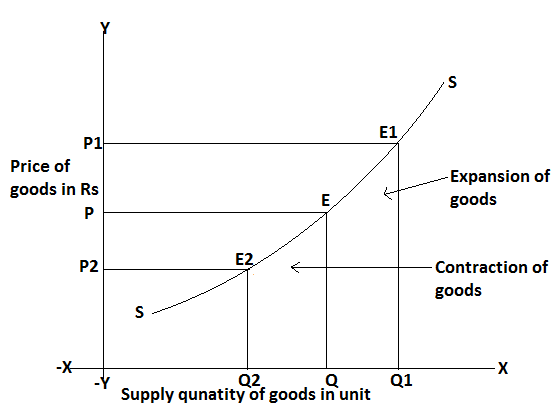
In this figure when the price moves rise from OP to OP1 the quantity supply increases from OQ to OQ1, this is called the expansion of the supply curve. In this situation equilibrium point moves E to E1 if the price falls from OP to OP2 and the quantity supply decrease from OQ to OQ2 this is called contraction of supply. In this situation, the equilibrium point moves from E to E2 here is the determining factor is constant.