
Published by: sadikshya
Published date: 28 Jun 2021
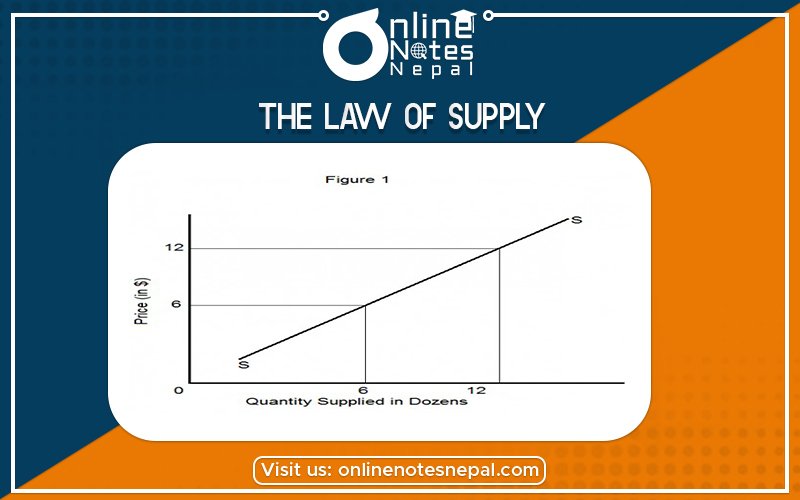
The law of supply establishes the direct relationship between price and quantity of goods and supply. According to this law supply of the commodities will increase with the increase in price and decrease with the decrease in price, other things remaining the same. Therefore, it states that keeping other things determinants of supply as constant, the supply decreases with the fall in prices and increases with the rise in prices, it means that the price of the commodity and its supply moves in the same direction.
The law of supply explains the relationship between price and the supply of the commodity. Price and supply are directly related that is if the price increases the supply of goods also increases in the same way decreases in price will reduce the supply. It is quite natural that in the case of an increase in price. The producer likes to multiply their profit. For this, they will be required to sell more quantity of goods and the supply of goods will increases. Higher price induces the seller to increase the supply of goods, law price reduces the margin of profit. So the producer reduces the supply. The law of supply based on the following assumptions.
On the basis of the above assumptions, the law of supply can be explained with the help of the following table.
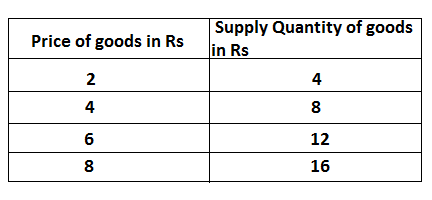
In the above table, the supply increase with the rise in price. At a price level of Rs 2 the quantity of supply in 4kg, it rises 8 to 12 and 16 kg with the price rising the level of Rs 4, 6 and Rs 8 per kg respectively. The relation between price and supply is shown in the following figure.
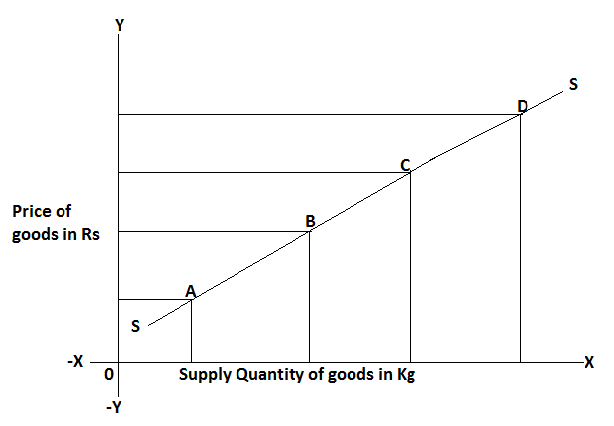
In this figure, the OX axis indicates the quantity of supply OY axis indicates the price of goods. The supply curve is represented by curve SS which is drawn with the help of a different combination of price, units of quantity supply of a commodity that is A, B, C and D. thus supply line has a positive slope seems there are positive relationships between the price and quantity supply.