
Published by: sadikshya
Published date: 02 Jul 2021
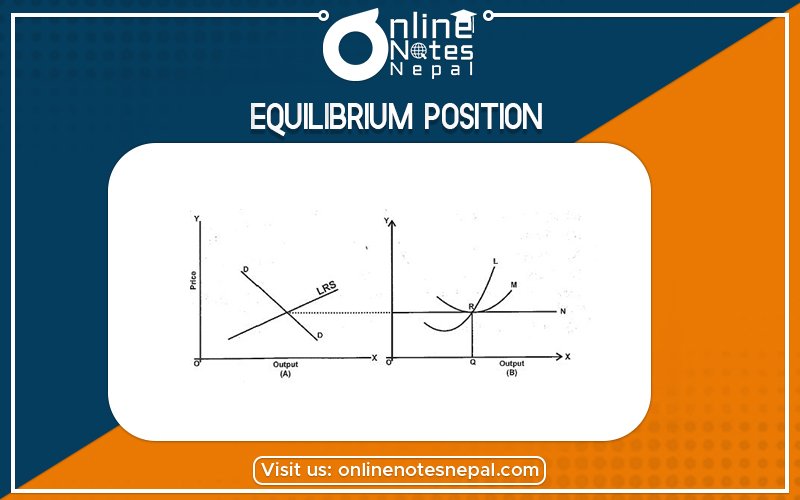
Every market is in equilibrium position when the total demand for goods and equal to the total supply of goods. The interaction between demand and supply determines the price, as well as the number of goods and services, produce in the market the interaction point is known as the equilibrium point. In this sense, Marshall defines that as both blades of a scissor are important to cut a piece of cloth so, it is demand-supply essential for the determination of price. Thus market equilibrium can be clearly described by a given table.
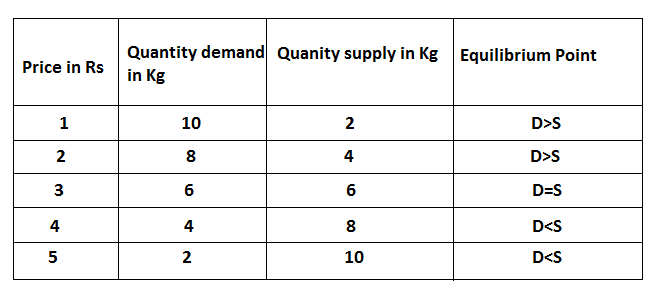
This table shows the inverse relationship between price and quantity demand and a positive relationship between price and quantity supply. When the price is Rs 1 quantity demand is 10 kg and the quantity supply is 2 kg. When the price rise to Rs 2 quantity demand is 8 kg and supply is 4kg. A further rise in price Rs 5 the supply quantity and demand quantity is equal. Again the rise in the price to Rs 4 and 5 there is excess supply, as a result, there should decrease the price at the point when the demand and supply are equal. It can be explained with the help of the following figure.
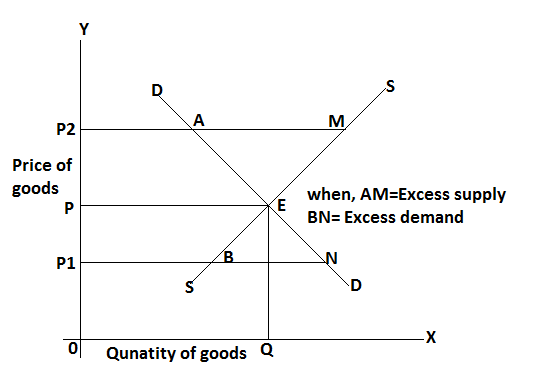
In the above figure, shows the interacti9on between demand and supply. Demand and supply curves are represented by DD and SS respectively. The mark is in equilibrium at point E when quantity demand is equal to quantity supply. The equilibrium price and output are determined and represented by OP and OQ respectively. The price increases from OP to OP2 there is excess supply by AM and where price decrease from OP to OP1 there is excess demand by BN. Thus the market is equilibrium at point E where OP price and OQ output are determined.