
Published by: sadikshya
Published date: 28 Jun 2021
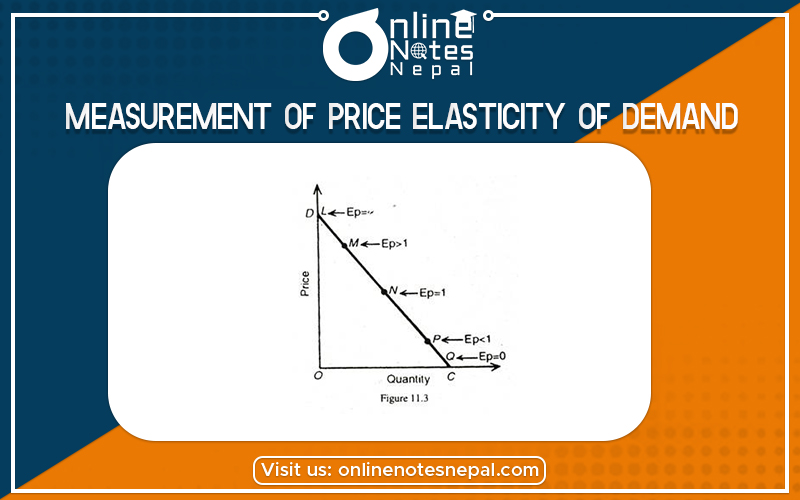
Measurement of Price Elasticity of Demand is the changes in the expenditure of the consumers on the commodity as the piece changes are also known as the outlay method. It was given by Marshall. According to Marshall Elasticity of demand can be measured by considering the changes in price and the subsequent change in the total quantity of goods purchased and the total amount of money spend on it.
Marshall distinguishes between three separate cases of change in total outlay resulting from a change in the price of the commodity.
If a small fall in price results in an increase of total outlay on the commodity. The elasticity of demand in this range of price variation is said to be greater than one. In such cases total outlay and price move in the opposite direction.
If with a small change in the price of commodity total expenditure by consumers on its purchases remaining the same the elasticity of demand with that range of price change is equal to one.
If with a small fall in the price of the commodity total expenditure on it also falls. The elasticity of demand in that range of price change is said to be less than one. In other words, if total outlay and price move in the same direction elasticity of demand is taken to be less than one.
These three cases can be explained by the following table:
| Price in RS | Amount demand in kg | Total expenditure | elasticity |
| 10 | 1 | 10 | EP>1 |
| 9 | 2 | 18 | EP>1 |
| 6 | 5 | 30 | EP=1 |
| 5 | 6 | 30 | EP=1 |
| 4 | 7 | 28 | EP<1 |
| 3 | 8 | 24 | EP<1 |
In the above table the price of the commodity goes down from Rs 10 to Rs 3 with the fall I price level that quantity demand of that commodity is increase. We can calculate the resulting changes in total expenditure. It can be explained by the following figure:
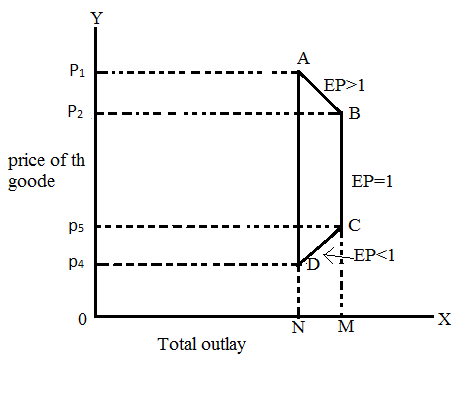
In the above figure total expenditure and prices are measured OX axis and OY axis respectively the position of A to B there is an inverse relationship between price and total expenditure, which shows that the total expenditures raise when the price falls and vice versa. So it shows the elasticity of demand is greater than one the position B to C is parallel to the OY axis, which shows there is no change in total expenditure at all when there is a change in price. In the position of C and D, there is a positive and direct relationship between total expenditure and price. When the price of goods falls the total expenditure of consumers also fall which shows that the price elasticity of demand is less than one.