
Published by: sadikshya
Published date: 28 Jun 2021
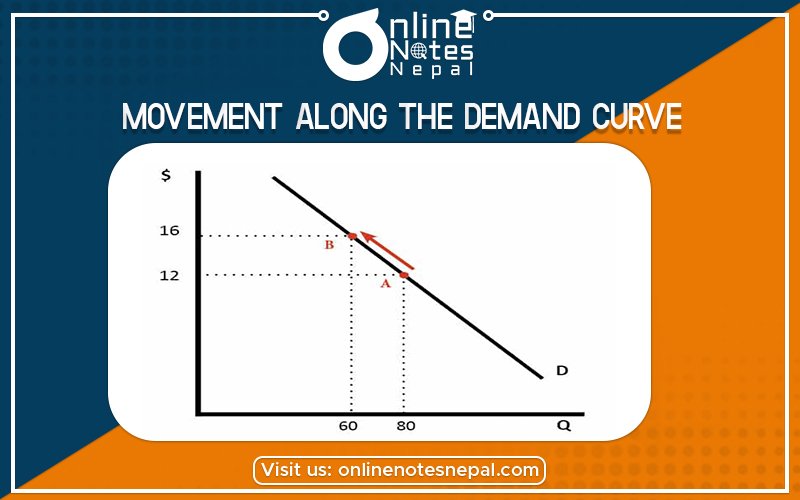
If the quantity demand changes due to change in price, keeping other factor constants it is known as movement along the demand curve. Thus it is changed in quantity demand because of a change in price. It is in two types.
Other determinants of demand remaining constant with the fall in price the quantity demand increases it is called expansion demand.
When the price raises the quantity demand falls, other determinants of demand remaining constant this is called contraction of demand.
Movement along the demand curve can be explaining with the following figure.
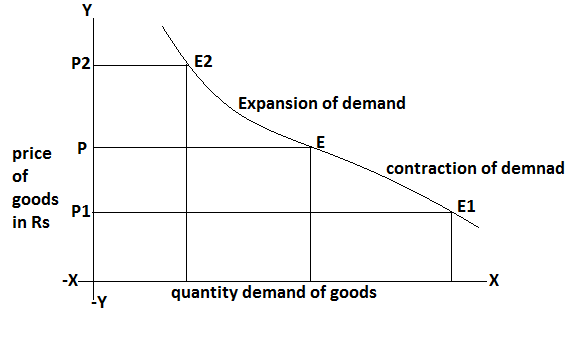
In the above diagram point, E is the initial equilibrium, where the price of goods OP then quantity demand of the goods if OQ. If the price of goods falls OP to OP1 the quantity demand of rises OQ to OQ1. Thus there is an extension in demand by the amount Q1 which shows by the movement demand curve from E to E1 on the contrary if the price of goods rises from OP to OP2 the quantity demand for goods falls to OQ2 thus there is a contraction in demand by OQ2 which is shown by the movement demand curve E to E2 this is call contraction of demand.
The shift in demand refers to a change in quantity demanded due to changes in other factors. This change is two types.
When there is a rise in demand at a given price cause by other determinants of demand, it is known as an increase in demand.
When there is a fall in demand at a given price cause by other determinants of demand. It is known as a decrease in demand.
There will always be a leftward of the demand curve. The shift in the demand curve can be explained with the help of the following figure.
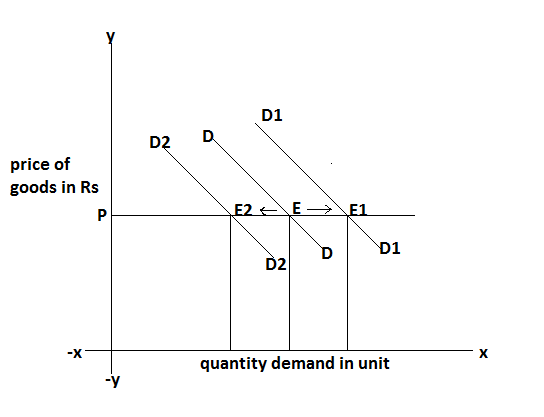
In the above figure, at the price OP when quantity demand decrease from OQ to OQ2 demand curve shift to the left DD to D2D2. This is called a decrease in demand. On the other hand, when quantity demand increase from OQ to OQ1 demand shifts to the right DD to D1D1, which is called an increase in demand.