
Published by: Dikshya
Published date: 21 Jul 2023
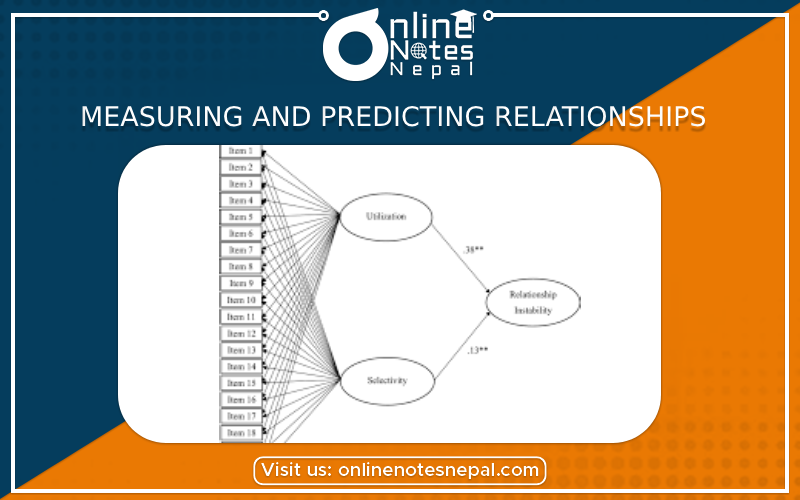
In data analysis, measuring and predicting relationships between variables is a fundamental task that helps us gain insights, make informed decisions, and build predictive models. It involves exploring the connections, dependencies, and associations between different variables within a dataset. Here's a comprehensive overview of the key techniques used for measuring and predicting relationships in data analysis:
1. Correlation Analysis: Correlation analysis measures the strength and direction of the linear relationship between two continuous variables. The most common correlation coefficient is Pearson's correlation coefficient, which ranges from -1 to +1. A positive value indicates a positive correlation, while a negative value indicates a negative correlation. A value close to 0 suggests little or no linear relationship. Correlation analysis helps identify how two variables move together, but it does not imply causation.
2. Scatter Plots: Scatter plots visually display the relationship between two continuous variables. Each data point represents an observation with its x and y values, allowing us to observe patterns and trends. Positive correlations are represented by points trending upwards, negative correlations by points trending downwards, and no correlation by a random scatter of points.
3. Regression Analysis: Regression analysis is used to predict the value of one continuous variable (dependent variable) based on the values of one or more other variables (independent variables). It models the relationship between the variables and helps predict future values. Simple linear regression involves one independent variable, while multiple linear regression includes more than one. Regression analysis also provides information about the strength and significance of the relationships.
4. Causality and Causal Inference: Establishing causal relationships between variables is more complex than measuring associations. Causality requires rigorous experimental design or advanced statistical methods, like randomized controlled trials or causal inference techniques such as propensity score matching, difference-in-differences, or instrumental variable analysis. Causal inference helps identify cause-and-effect relationships.
5. Cross-Tabulation and Chi-Square Test: Cross-tabulation is used to examine the relationship between categorical variables. It creates a contingency table that shows the distribution of one variable concerning the other. The chi-square test is then used to determine whether there is a significant association between the variables or if their distribution is due to chance.
6. Time Series Analysis: Time series analysis deals with data collected over time and focuses on understanding patterns, trends, and seasonality. Techniques like Autoregressive Integrated Moving Average (ARIMA) models or Seasonal Decomposition of Time Series (STL) can be used to predict future values based on historical patterns.
7. Machine Learning Algorithms: In predictive analytics, various machine learning algorithms, such as decision trees, random forests, support vector machines, and neural networks, are used to predict outcomes or relationships between variables. These algorithms can handle complex relationships and make predictions based on patterns in the data.
8. Feature Importance and Variable Selection: When building predictive models, determining the importance of features (variables) is essential. Techniques like feature importance scores or stepwise variable selection help identify the most influential variables for prediction.
Overall, measuring and predicting relationships in data analysis require a combination of statistical techniques, visualization tools, and machine learning methods. The goal is to gain a deeper understanding of the data, identify patterns, and develop reliable models for prediction and decision-making. However, it's crucial to interpret results carefully, considering the limitations of the analysis and the context of the data being analyzed.
Test of Correlation Coefficient in Data Analysis:
Correlation analysis is a statistical technique used to measure the strength and direction of the relationship between two or more variables. It is commonly employed in data analysis to understand how changes in one variable are associated with changes in another variable. The correlation coefficient, often denoted by the symbol "r," is a numerical value that quantifies the degree of correlation between variables. There are various tests used to assess the significance of the correlation coefficient, and the most common one is the Pearson correlation coefficient test. Let's explore the steps involved in testing the correlation coefficient:
Step 1: Hypotheses Formulation: The first step in testing the correlation coefficient is to formulate the null and alternative hypotheses. For the Pearson correlation coefficient test, the hypotheses are as follows:
Step 2: Data Collection: Collect the data on the two variables of interest. Make sure that you have a sufficient number of data points to obtain reliable results.
Step 3: Calculate the Sample Correlation Coefficient (r): Compute the sample correlation coefficient (r) using the formula for Pearson correlation coefficient:
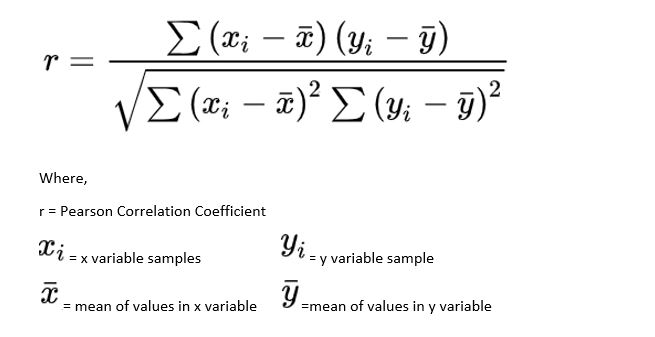 Pearson correlation coefficient formula
Where:
Step 4: Determine the Critical Value or P-Value: To test the significance of the correlation coefficient, you need to determine either the critical value or the p-value. The critical value is compared to the calculated correlation coefficient (r), while the p-value indicates the probability of observing the correlation coefficient by chance.
Step 5: Compare the Results:
Step 6: Interpretation: After performing the test, interpret the results in the context of your data. A positive correlation coefficient (r) indicates a direct relationship between the variables, meaning they increase together. A negative correlation coefficient (r) suggests an inverse relationship, where one variable increases while the other decreases. The magnitude of the correlation coefficient indicates the strength of the relationship, with values closer to +1 or -1 representing stronger correlations.
Keep in mind that correlation does not imply causation. Even if a significant correlation is found between two variables, it does not necessarily mean that changes in one variable cause changes in the other. Other factors may be influencing the relationship, and further research or experimentation may be required to establish causation.
Overall, testing the correlation coefficient is a valuable tool in data analysis to identify and quantify relationships between variables, aiding in making informed decisions and predictions based on observed patterns in the data.