
Published by: sadikshya
Published date: 04 Jun 2021
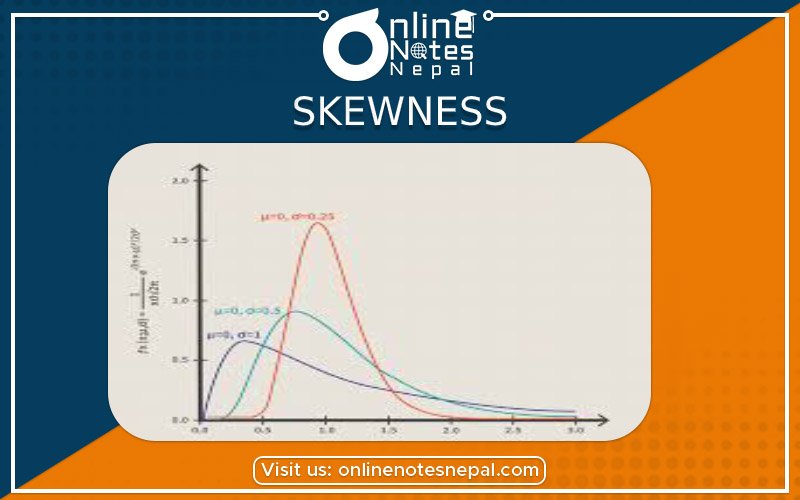
Skewness is the representation of an imbalance and asymmetry from the mean of data distribution. It is a descriptive statistical measure used to measure the shape of the curve drawn from the frequency distribution.
1. No skewness or symmetrical
2. Positive Skewness
These are positively-skewed (or right-skewed) to an increasing degree.
3. Negative Skewness
Negatively-skewed (or left-skewed) distributions are also known as left-skewed distributions.
The five-number summary provides the five descriptive measures in a data set. It contains the minimum value, lower quartile, median, upper quartile, and maximum value. It is helpful in determining the set of the curve.
A five-number summary is especially useful in descriptive analyses or during the preliminary investigation of a large data set. A summary consists of five values: the most extreme values in the data set (the maximum and minimum values), the lower and upper quartiles, and the median. These values are presented together and ordered from lowest to highest: minimum value, lower quartile (Q1), median value (Q2), upper quartile (Q3), maximum value.
It is a graphical presentation of data that displays a five-number summary in a data set based on minimum value, lower quartile, median, upper quartile, and the maximum value.
In a box plot, we draw a box from the first quartile to the third quartile. A vertical line goes through the box at the median. The whiskers go from each quartile to the minimum or maximum.